
Structural map of Eastern Eurasia
16,00 €
Structural map of Eastern Eurasia
Equatorial scale: 1/12 500 000
Published in August 2008
1 sheet :118 x 84 cm
CCGM-CGMW
Main author : Manuel Pubellier (CNRS-Ecole Normale Supérieure Paris)
Main contributors: N. Chamot-Rooke (CNRS-Ens, F. Ego (Ens), J.C. Guézou (CNRS), E. Konstantinovskaya (INRS-ETE), A. Rabaute (Ens-GeosubSight), J.C. Ringenbach (TOTAL)
Availability: In stock
Description
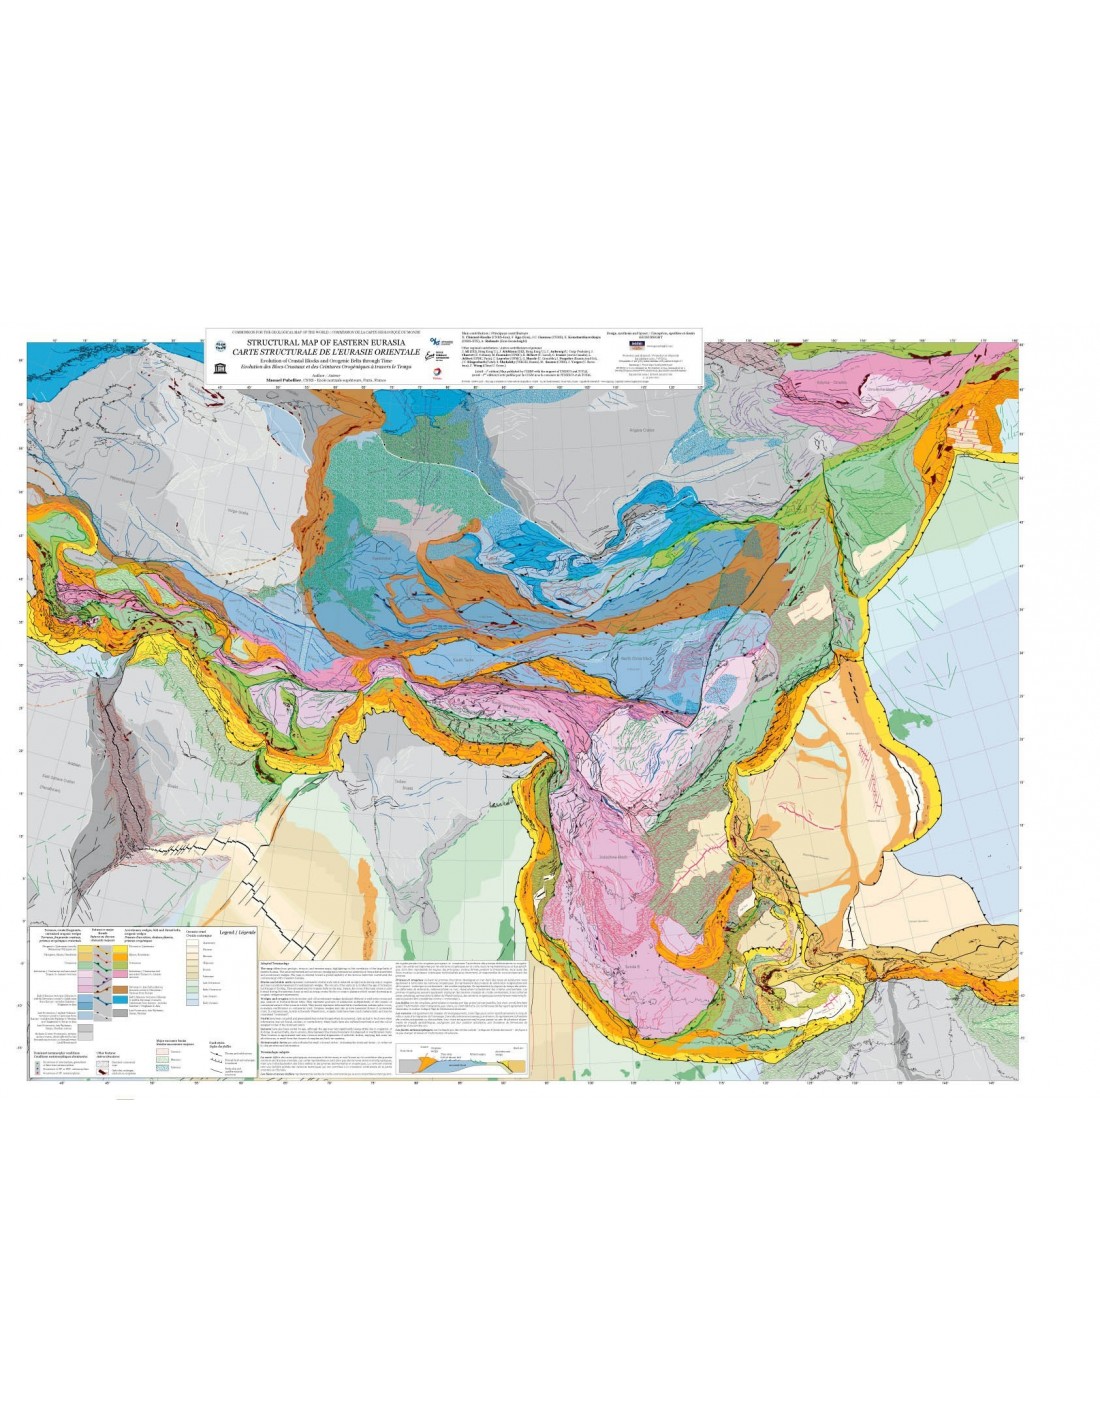
Structural map of Eastern Eurasia
Evolution of the Crustal Blocks and Orogenic Belts through time
The map differs from geological, tectonic and terrane maps, and emphasises the correlation of the great Eurasian belts. The units shown are not therefore tectono-stratigraphic terranes, but rather an individualisation of stable blocks and sedimentary and orogenic prisms.
The map is designed to give an overall view of the tectonic belts that have contributed to the continental growth of eastern Eurasia.
Stable blocks and zones represent units of continental crust that have behaved as rigid entities during major orogens and form the autochthonous part of sedimentary or orogenic prisms. These units are separated by orogenic belts on the map, but do not represent a specific age.
The cores of the main cratons formed during the Precambrian are therefore represented, as are the crustal blocks or oceanic plateaux formed more recently and responsible for the shortening of the prisms.
Prisms and orogens include accretionary prisms developed at sea in subduction zones and on land in orogenic belts. They represent the products of subduction, regardless of the nature - oceanic or continental - of the crusts involved. In most cases, they represent deformed belts of sediments, metamorphosed or not, currently overlapping continental crusts.
Structural map of Eastern Eurasia
Orogenic prisms can also involve crustal strips of continental crust. In complex areas, especially in the early Phanerozoic, orogenic belts are strongly metamorphosed and can be considered as "cratonised".
The Rifts have been compiled, generalised and classified by age where possible. Choices had to be made when information was missing, unclear, or contradictory. Many faults have also been reactivated; the colour indicates the age of the dominant event.
The sutures have also been classified chronologically, but the age may vary significantly along them as a result of migration of the docking. In ancient belts, by erosion, they represent the boundary of juxtaposed or overlapped crusts. Their course is approximate and may pass through several alignments of ophiolithic massifs, highlighting either their allochthonous position or the existence of arc/back-arc system closures.
The metamorphic facies are indicated by coloured dots - indicating the dominant facies - so as not to load and obscure the structural information.
Structural map of Eastern Eurasia
Informations complémentaires
| Weight | 0,14 kg |
|---|---|
| Packaging | Tube (e.g. rolled card), Envelope (e.g. folded card or booklet) |
| Length | |
| Width | |
| Weight | |
| Scale |


