A new look for our website! 🌱
As part of our commitment to the environment, we are in the process of switching to a more environmentally-friendly hosting provider. The site is currently being prepared for this transition.
Orders are temporarily suspended while the migration is finalised.
Thank you for your patience and support.
We look forward to seeing you soon with an even more ethical and efficient site!

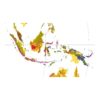
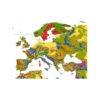
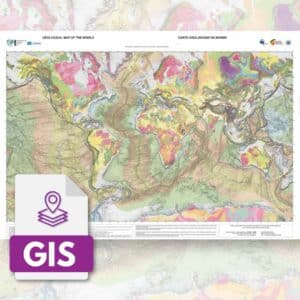
Lithological map of the World
16,00 €
Lithological map of the World
1st edition
Scale: 1/35 000 000
Main map in Eckert IV projection
Dimensions: 118 x 80 cm
Authors: Nils Moosdorf (Leibniz Center for Tropical Marine Ecology (ZMT), Bremen, Germany) and
Jens Hartmann (Institute for Geology, CEN - Center for Earth System Research and Sustainability, Universität Hamburg, Germany)
©CCGM-CGMW 2015
Description
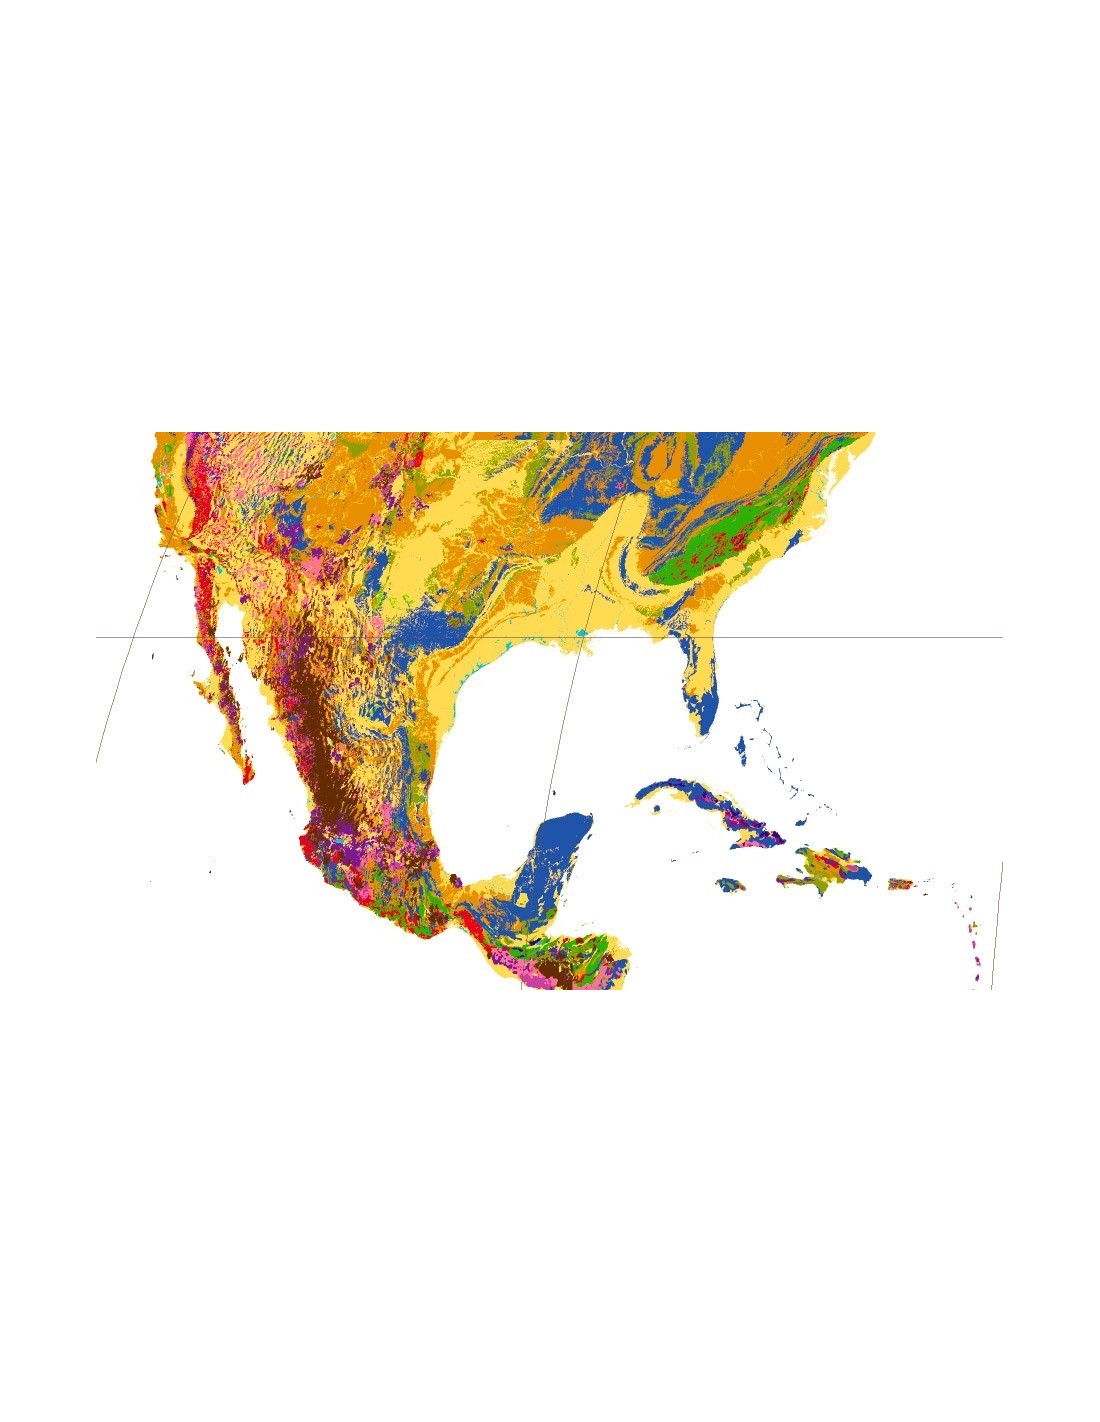
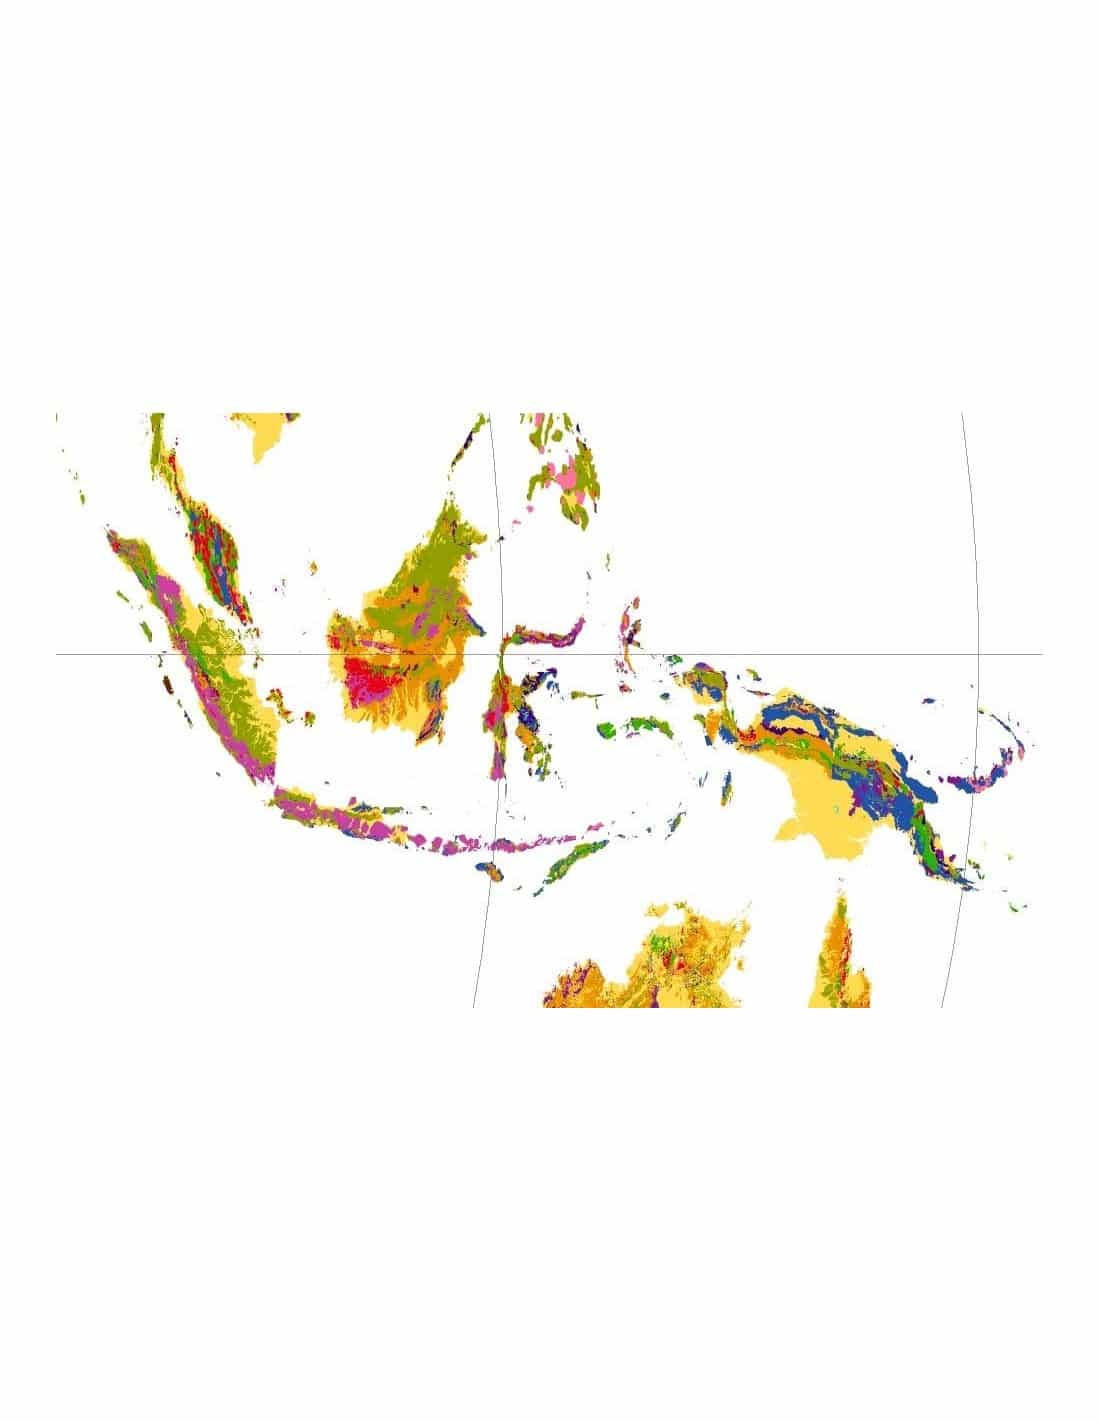
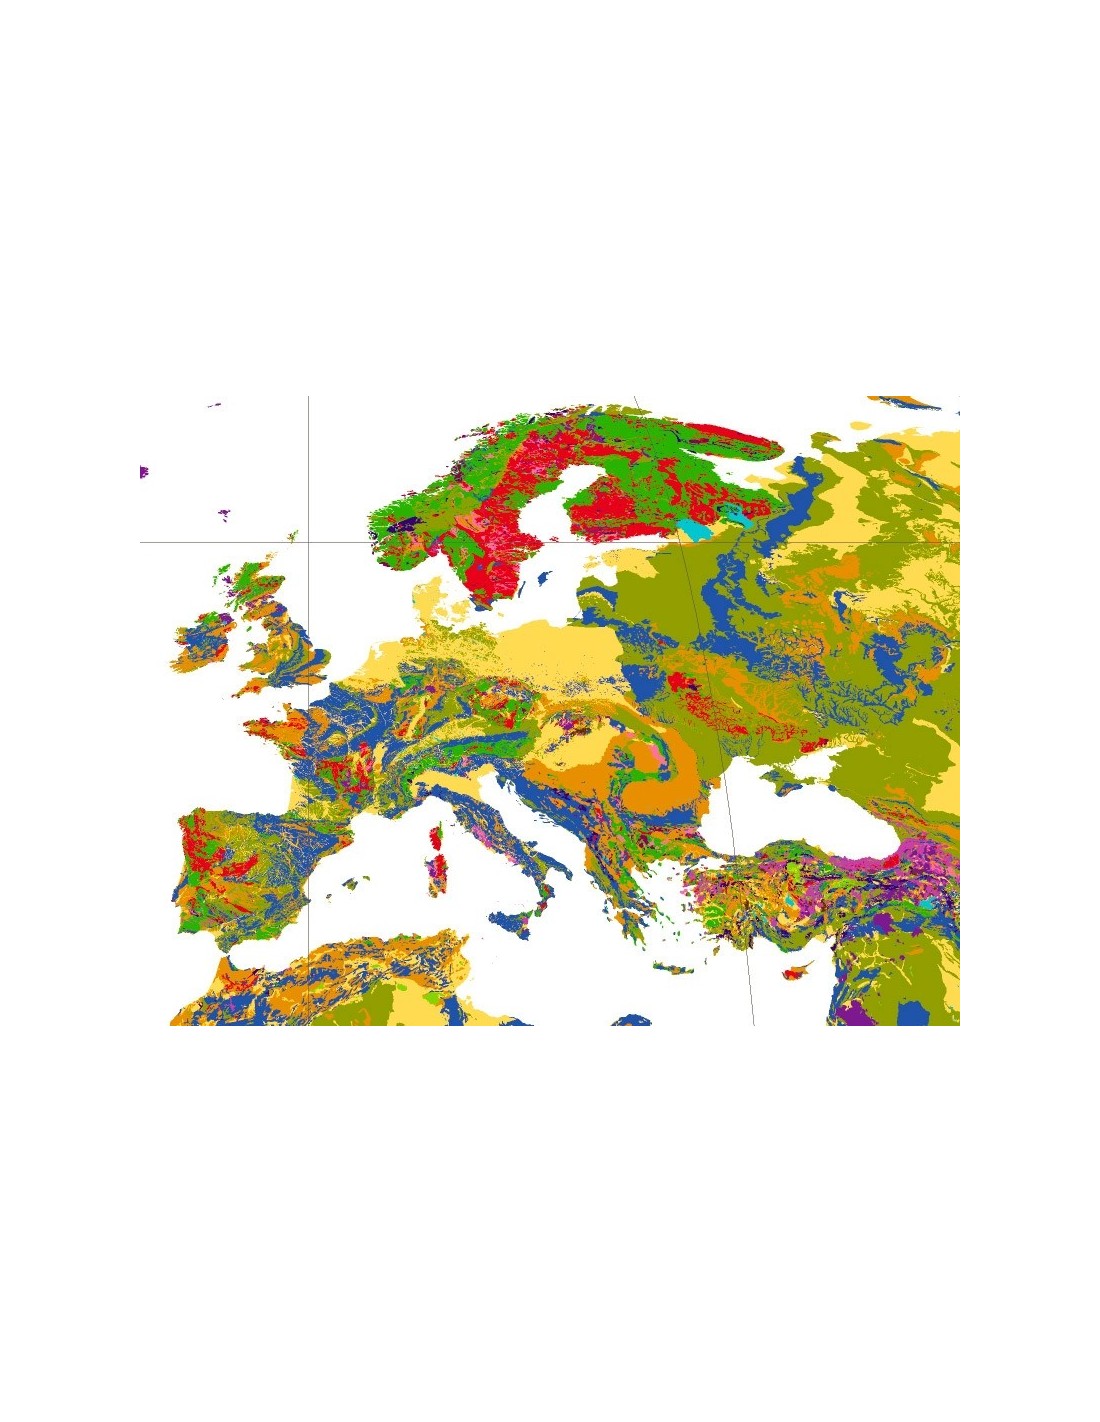
Lithological map of the World
Lithology describes the geochemical, mineralogical and physical properties of rocks. It plays a fundamental role in the processes that control the flow of materials at the surface to soils, ecosystems, rivers and oceans. The Lithological map of the World was compiled from the Lithological Map of the World database (in English Global Lithological Map, v1.1, GLiMHartmann and Moosdorf, 2012).
In the GLiMThe rock types on the Earth's surface were represented by 1 235 400 polygons obtained from 92 regional geological maps. These polygons were converted into lithological units using information from the available literature. From the database GLiMAs a result, the surface of the continents and islands is covered by : 64% of sediments (one third of which are carbonates), 13% of metamorphic rocks, 7% of plutonic rocks and by 6% of volcanic rocks, the remaining 10% being covered by water in liquid form and ice.
The high resolution of the GLiM allows to visualise the distribution of the regional lithology - which often shows variations from the global average - and also to analyse regionally the processes taking place at the Earth's surface on a global scale. A larger mesh version of the GLiM is available at : PANGEA Database (http://dx.doi.org/10.1594/PANGAEA.788537), the GIS data of the Lithological Map of the World are available using this link (https://www.dropbox.com/s/9vuowtebp9f1iud/LiMW_GIS%202015.gdb.zip?dl=0).
This map was compiled from national - or even cross-border - geological maps with a resolution of 1 millionth or greater. However, where national geological maps of the required resolution were not available, depending on the case, either less detailed maps (e.g. Africa) or higher resolution maps (e.g. the combination of geological maps by state from the preliminary database of the geological map of the USA) were used.)
As a result, the density of the information represented on the map is not uniform (see the box Regional data scales). The "average" scale of the map is 1:3,750,000. The combination of maps produced using different reference frames may locally reflect administrative boundaries and result in artificial geological limits. The authors of the map did not wish to alter the criteria used by local geological experts, despite the questionable scientific relevance of these boundaries and the resulting aesthetic flaws. A second stumbling block in the process of compiling the map was the representation of the quaternary cover.
Depending on the geological map, the Quaternary can either i) be omitted altogether, ii) be represented from a certain thickness (e.g. 2 metres), or iii) be shown regardless of its thickness.
The scale of the Lithological map of the World is, in most areas, more detailed than in its graphical representation at a scale of 1:35 000 000. The digital version of the map is available online (https://www.dropbox.com/s/9vuowtebp9f1iud/LiMW_GIS%202015.gdb.zip?dl=0) allows more detail to be enlarged and visualised, as is the case for Hawaii. Compared to previous global lithology maps, the improved representation of tropical islands (Bluth and Kump, 1991; Amiotte-Suchet et al., 2003; Dürr et al., 2005) is one of the strengths of the present map, as these islands are quite often under-represented on a global scale due to their small area.
To view the map in 3D, click on this link:
https://www.clisap.de/fileadmin/B-Research/IA/IA5/LITHOMAP/dev/lithomap.html
Lithological map of the World
Informations complémentaires
| Weight | 0,13 kg |
|---|---|
| Packaging | Tube (e.g. rolled card), Envelope (e.g. folded card or booklet) |
| Length | |
| Width | |
| Weight | |
| Scale |