A new look for our website! 🌱
As part of our commitment to the environment, we are in the process of switching to a more environmentally-friendly hosting provider. The site is currently being prepared for this transition.
Orders are temporarily suspended while the migration is finalised.
Thank you for your patience and support.
We look forward to seeing you soon with an even more ethical and efficient site!
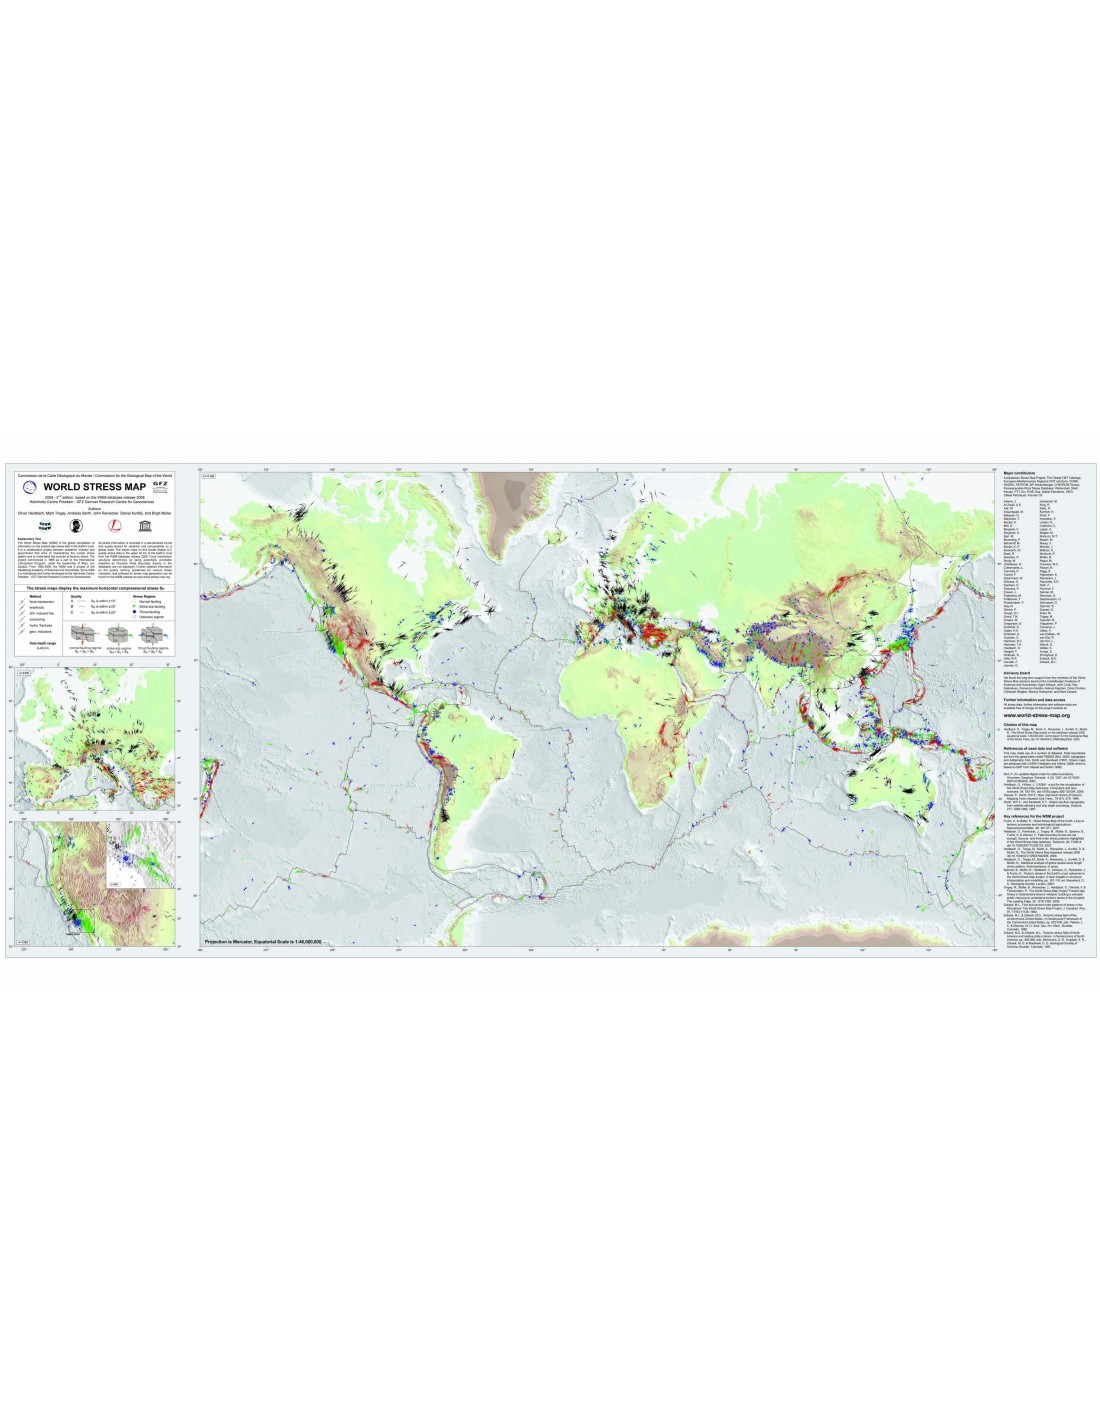
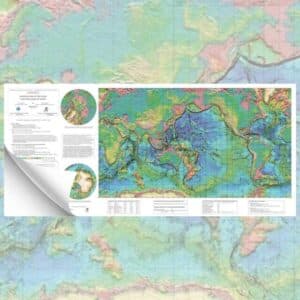
World map of tectonic stresses
16,00 €
World map of tectonic stresses
Equatorial scale: 1:46 000 000
Published in April 2007
1 sheet: 120 x 54 cm
Supplied with a CD containing the database and the digital version of the map
CCGM-CGMW / Heidelberg Academy of Sc. and Humanities 2007
Authors: O. Heidbach, K. Fuchs, B. Müller, J. Reinecker, B. Sperner,
M. Tingay & F. Wenzel
Description
World map of tectonic stresses
The World Stress Map is a global compilation of information on current tectonic stress fields in the Earth's crust. It is an international collaborative project involving universities, industry and government organisations with the aim of understanding the sources of stress within the Earth's crust.
The project started in 1986 under the auspices of the International Lithospheric Programme under the leadership of Mary Lou Zoback. Since 1995, the WSM has been one of the research projects of the Heidelberg Academy of Sciences and Humanities, based at the Institute of Geophysics at the University of Karlsruhe in Germany.
The map is accompanied by a CD-ROM of the WSM database containing 13,853 data sets from a wide range of stress indicators, from surface to depth, including: focal mechanisms, borehole deformation, drilling-induced fractures, hydraulic fracturing, stress release measurements and neotectonic indicators (Quaternary).
In order to consolidate the constraint data from different sources into a common database, it was necessary to set up classification standards for all constraint indicators. This classification ensures the reliability and comparability of the collected data at the global level.
World map of tectonic stresses
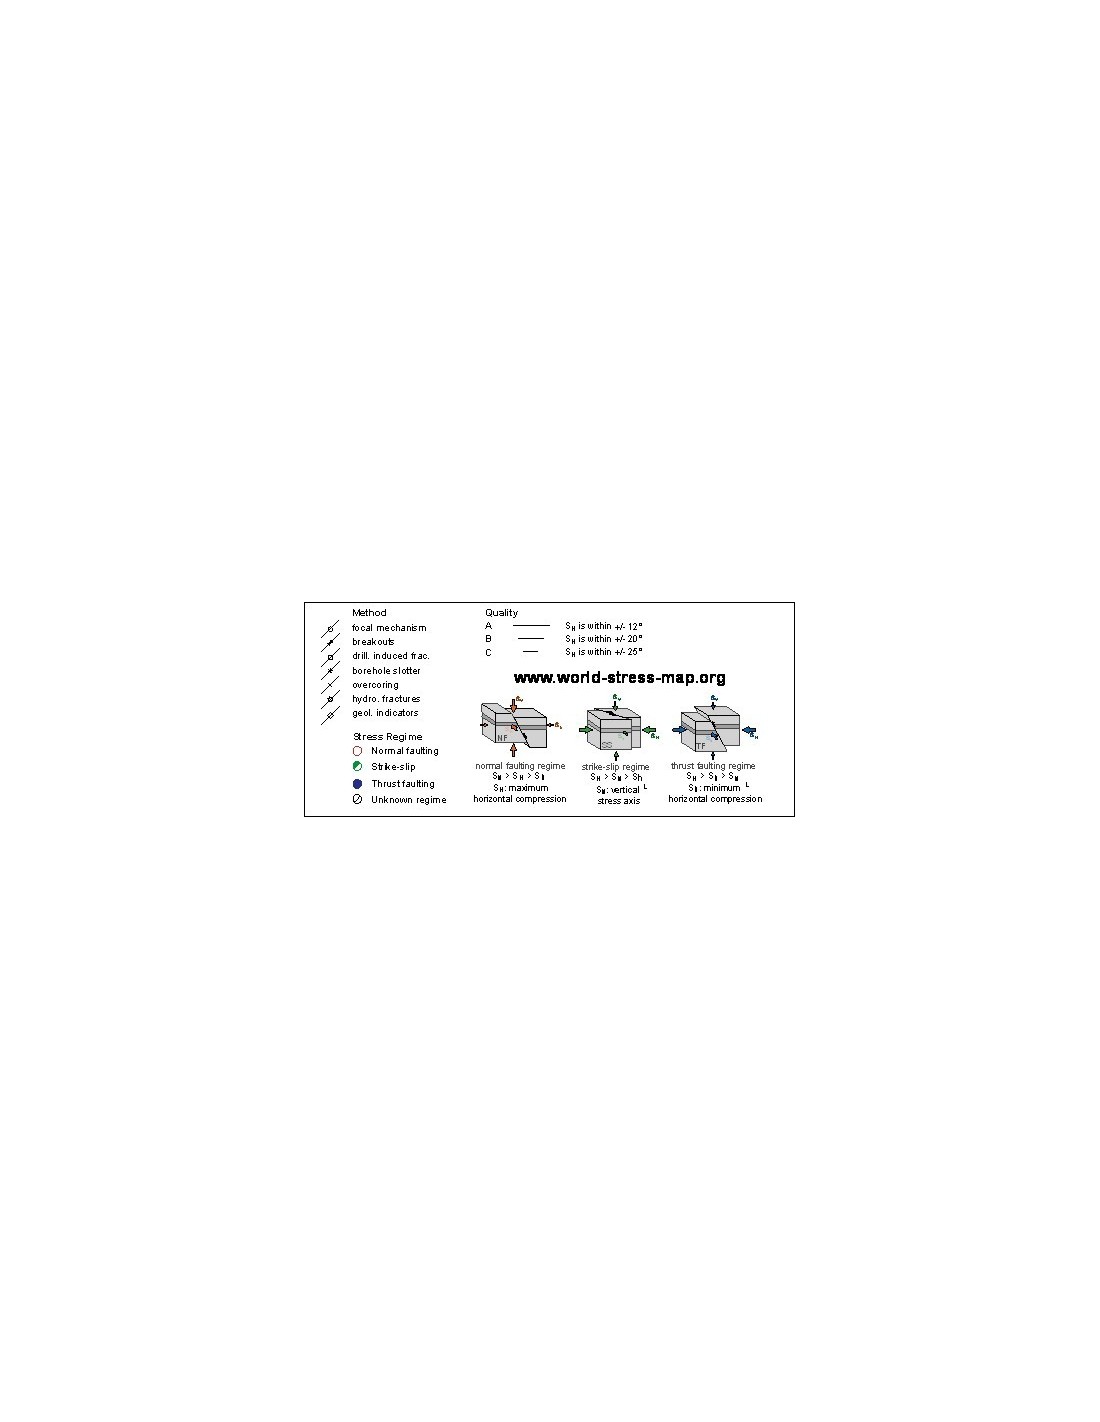
Thus, each stress data was graded on a quality scale from A to E, with A being the maximum grade. Quality A data indicates that the maximum horizontal stress orientation (SH) is accurate to within ±15°; for quality B data it is within ±20°; for quality C data it is within ±25° and for quality D data it is within ±40°. Grade E corresponds to insufficient data or too sparse stress information.
More than 10,500 quality A to C data sets are contained in the 2005 version of the database.
The WSM database is a first-rate source for scientists and engineers in universities and industry.
This information is very useful for understanding geodynamic processes, for assessing seismic risks and tunnel stability, and also for improving hydrocarbon production, the safety of underground waste deposits and greenhouse gases, as well as for geothermal energy production.
World map of tectonic stresses
For more information, please visit http://www.world-stress-map.org.
This WSM site also contains regional stress maps, software, instructions for stress interpretation, and a quick "Create a Stress Map Online" (CASMO) interface linked to a database that allows users to order high quality graphical stress maps online to their own specifications, and receive them by email almost simultaneously.
To visualise the WSM data, the orientation of the maximum horizontal compressional stresses is shown in the stress maps. The data selected for the World Tectonic Stress Maps are from the 2005 version which includes data for depths between 0-40 km and quality A to C, with the exception of focal mechanism data classified in the database as Possible Plate Boundary (PBE) or 200 km away from ocean accretionary axes.
World map of tectonic stresses
Informations complémentaires
| Weight | 0,25 kg |
|---|---|
| Packaging | Tube (e.g. rolled card), Envelope (e.g. folded card or booklet) |
| Length | |
| Width | |
| Weight | |
| Scale |