Geodynamic map of the Mediterranean
16,00 €
Geodynamic map of the Mediterranean
Set of 2 sheets :
1- Tectonics and Kinematics ;
2- Seismicity and Tectonics
First edition, © CGMW, 2004
Projection: Mercator
Scale: 1/13,000,000 at the equator (i.e. approximately 1/10,000,000 at the centre of the map)
Dimensions: 99 x 53 cm.
Availability: In stock
Description
Geodynamic map of the Mediterranean
This publication is the result of a new cartographic concept developed at the CCGM.
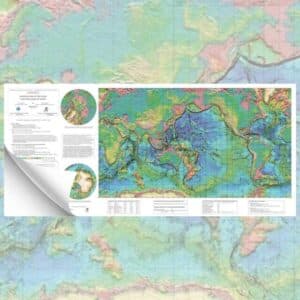
The primary objective of the Geodynamic Map of the Mediterranean was to produce a modern synthetic image of the current geodynamics of this region, based on different and heterogeneous data sources relating to recent tectonics, seismicity, kinematics and volcanism. It should be stressed that the Mediterranean area and the surrounding zones correspond to a key collision region where the Nubian, Arabian, Somali and Eurasian lithospheric plates interact.
We have chosen a relatively short period of time, from 300,000 years ago to the present day, covering the last two glacial maxima and the Eemian interglacial. We have assumed that the kinematic characteristics deduced from geodetic measurements have remained stable over this period, which is nevertheless long enough to provide geological evidence of activity along tectonic faults.
Geodynamic map of the Mediterranean
On Sheet 1, Tectonics and Kinematics, the main map shows: several types of tectonic fault (faults, thrust faults, etc.) that may have been activated or reactivated during the period considered above (Late Quaternary); plate movement velocity vectors; the 237 or so eruptive centres that are thought to have been volcanically active over the last 150,000 years.
Velocity vectors have been derived mainly from geodetic measurements provided by the latest GSRM model (2003). A Geodynamics insert summarises the geodynamic features of the main map: well-defined plate boundaries; zones of diffuse deformation; secondary plates (or blocks; e.g. Adriatic plate or Danakil block); plate motion vector field.
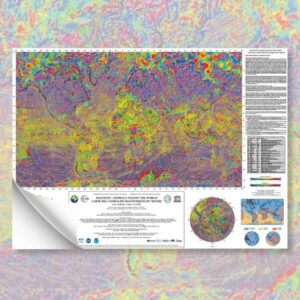
On sheet 2, Seismicity and Tectonics, the earthquakes have been plotted on the same tectonic diagram as on sheet 1. It should be remembered that seismicity is a major cause of natural hazards in this region, which on the map stretches from the Atlantic to the Indian Ocean and the Caspian Sea, and underlines current tectonic activity.
The selection of earthquakes comes mainly from the databases of the International Seismological Centre and covers the period 1964-2003. Only relocated events have been taken into account. Epicentres have been represented using symbols differentiated according to magnitude (3-4.4; 4.5-5.4; = 5.5) and depth of focus (0 - 50 km; 51-100 km; 101-300 km; > 300 km).
Two inserts have been added to this sheet, one showing the mechanisms at the focus, the other the tectonic sketch of the Mediterranean region, which shows the various small oceanic basins (Mesozoic fossil basins, Neogene basins) and post-orogenic basins (e.g. the Tyrrhenian Basin), as well as the main tectonic features.
Geodynamic map of the Mediterranean
Informations complémentaires
| Weight | 0,14 kg |
|---|---|
| Packaging | Tube (e.g. rolled card), Envelope (e.g. folded card or booklet) |
| Length | |
| Width | |
| Weight | |
| Scale |